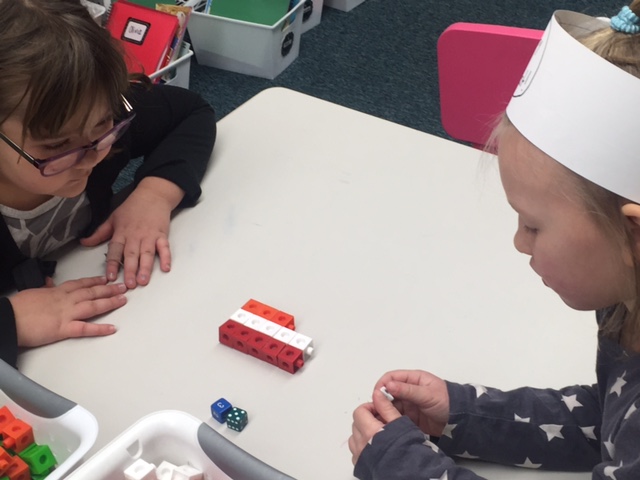
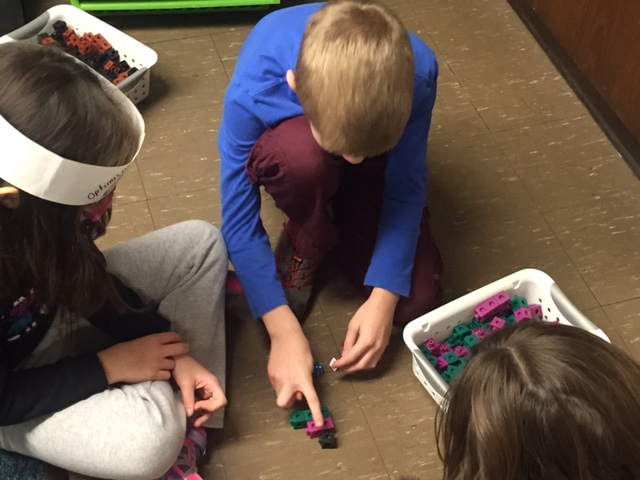
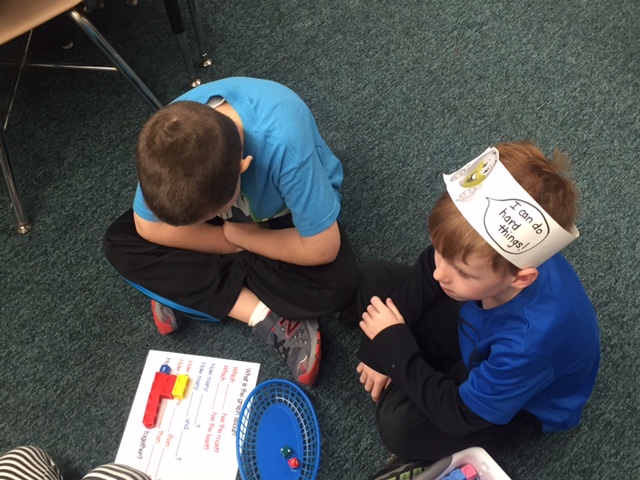
In our current math unit, students will be working with story problems that involve comparing. One of the most natural ways to visualize comparing is in graphing. We started this new learning, by reviewing old learning. We created graphs using linking cubes. We had three data points, which also allowed us to practice adding with three numbers and how to answer questions about graphs. Once we had the graph, we started talking about "How many more.... than ...." in terms the graph. This might have sounded like, "How many more children liked red apples than green apples?" or "How many less children liked pizza than hamburgers?" While using the cubes, the children were able to visually see the difference between the two "cube towers" representing numbers. This then got translated into story problems. The students have since learned how to show this on paper, using the graph visualization to help them draw a picture to solve it.


 RSS Feed